HomeDocumentation
Dashboard
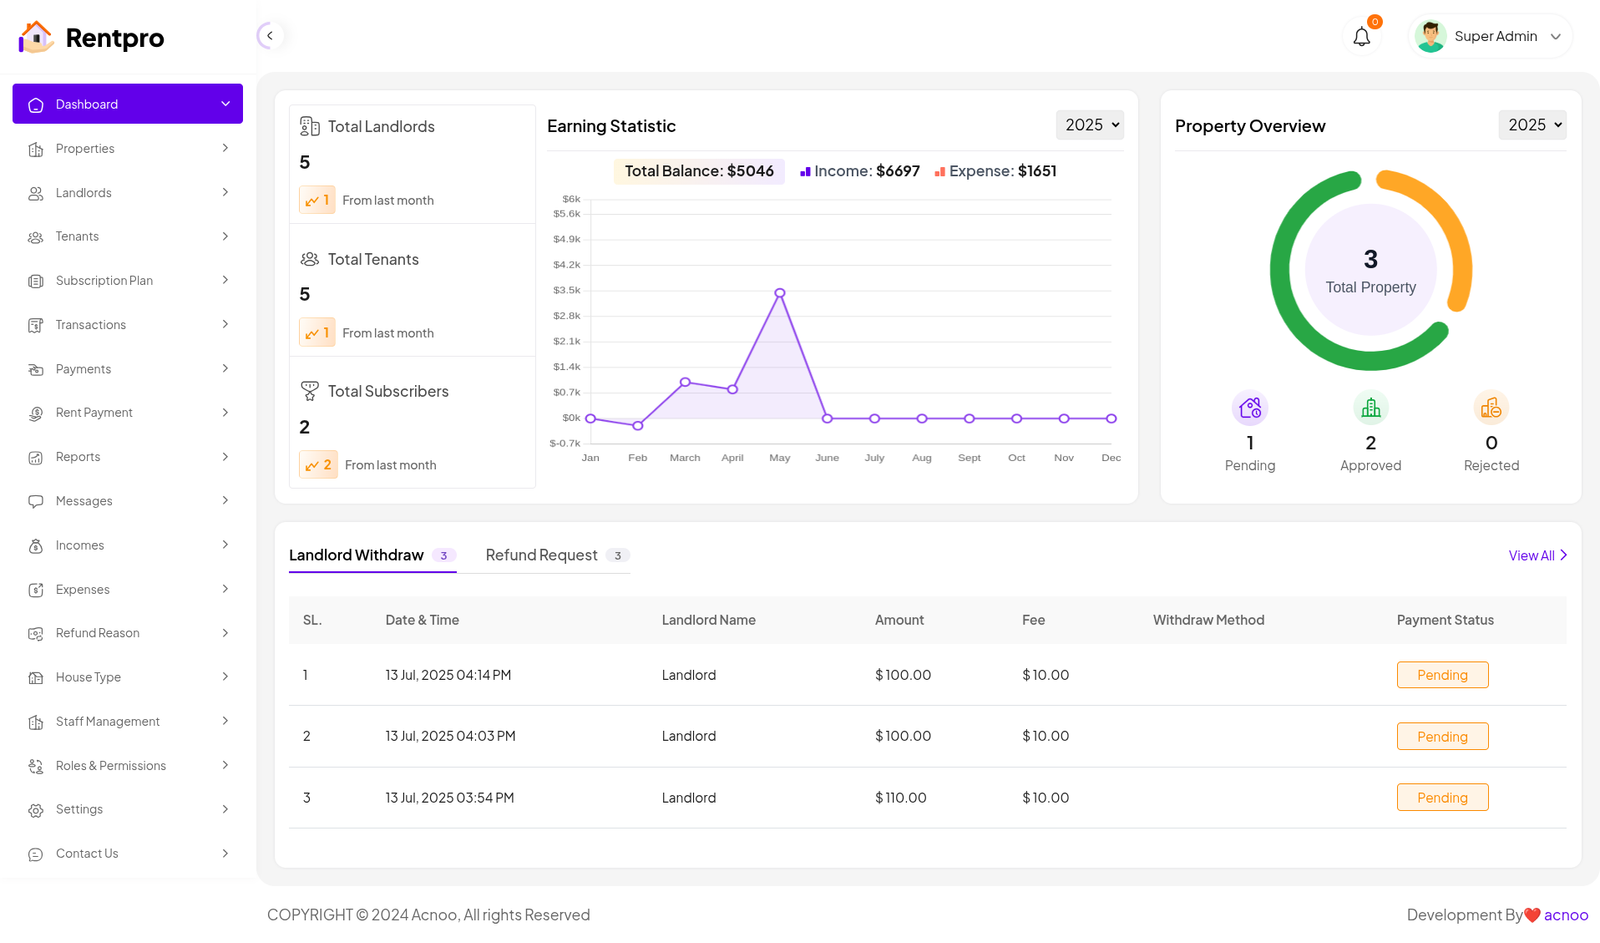
The top section of the dashboard presents a high-level summary of user accounts. It shows the total number of landlords, tenants, and subscribers. This provides a quick snapshot of the platform's user base and growth.
Earning Statistics: This section visualizes the platform's financial data. A line graph displays income trends over the course of the year, and a summary box shows the current total balance, total income, and total expenses. This gives administrators a clear picture of the platform's profitability and financial performance.
Property Overview: A visual summary of all properties is displayed here. A donut chart indicates the total number of properties, and a numerical breakdown shows how many are currently pending approval, approved, or rejected. This helps manage the property onboarding process.
Pending Actions: At the bottom, a table lists critical pending tasks. This includes landlord withdrawal requests and refund requests. For each request, details such as the date, landlord name, amount, and payment status are provided. This table acts as a task list for administrators to process important financial actions.
Articles in this section
- Getting Started
- Requirements
- Download Project from Envato
- Creating Database
- Uploading Files
- Installation Wizard
- Default Password
- Dashboard
- Property List
- Schedule
- Landlord List
- Tenant
- Subscription List
- Plan List
- Transaction
- Withdraw Method
- Rent Payment
- Landlord Withdraw
- Contact Message
- Income List
- Expense List
- Refund Reason List
- House Type List
- Facility List
- Amenity List
- Staff List
- Roles & Permissions
- Setting
- Contuct Us
- Mail Configuration / SMTP Setup
- Hostinger Panel
- Gmail
- Change Logs
Was this documentation helpful?
0 out of 0 found this helpful